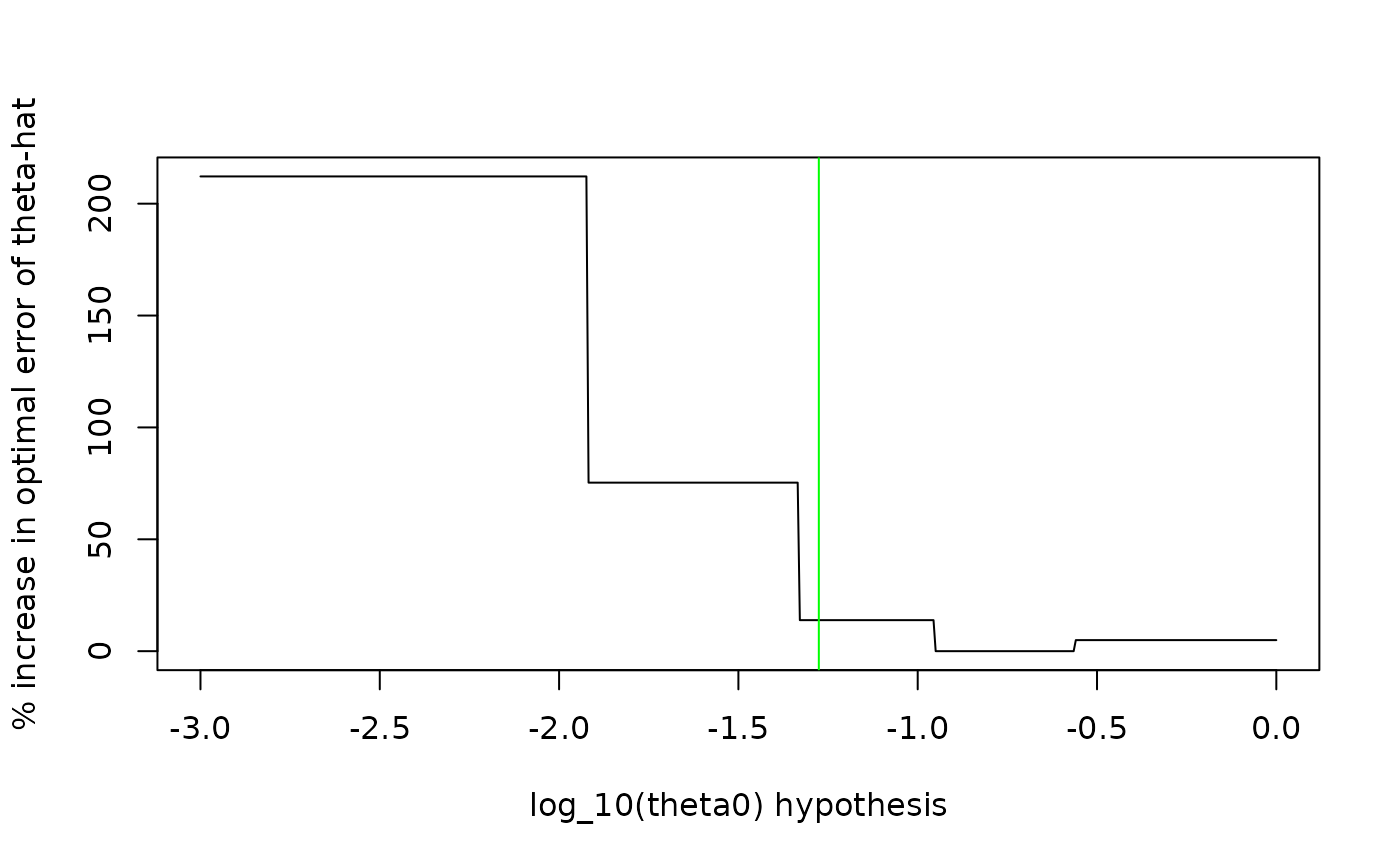
Plots a standard error estimate of thetahat (slope over intercept) over a range of possible theta0 values in order to investigate robustness of the the initial theta0 guess.
Source:R/public.R
err_vs_theta0_plot_for_homo_design.RdPlots a standard error estimate of thetahat (slope over intercept) over a range of possible theta0 values in order to investigate robustness of the the initial theta0 guess.
Arguments
- n
The number of experimental runs.
- xmin
The minimum value of the independent variable.
- xmax
The maximum value of the independent variable.
- theta
The putative true value. This is used to see how much efficiency given up by designing it for
theta0.- theta0_min
Simulating over different guesses of theta0, this is the minimum guess.
- theta0_max
Simulating over different guesses of theta0, this is the maximum guess.
- theta0
The guess used to construct the experimental design. Specify only if you wish to see this value plotted. Default is
NULL.- beta0
A guess to be used for the intercept. Defaults to
1.- sigma
A guess to be used for the homoskedastic variance of the measurement errors. If known accurately, then the standard errors (i.e. the y-axis on the plot) will be accurate. Otherwise, the standard errors are useful only when compared to each other in a relative sense. Defaults to
1.- RES
The number of points on the x-axis to simulate. Higher numbers will give smoother results. Default is
20.- Nsim
The number of models to be simulated for estimating the standard error at each value on the x-axis. Default is
1000.- error_est
The error metric for the estimates. The sample standard deviation (i.e.
sd) is unstable at low sample sizes. The default is the 90 percentile minus the 10 percentile.- theta_logged
Should the values of theta be logged? Default is
TRUE.- error_pct
Plot error as a percentage increase from minimum. Default is
TRUE.- plot_rhos
Plot an additional graph of rho by theta0. Default is
FALSE.- ...
Additional arguments passed to the
plotfunction.