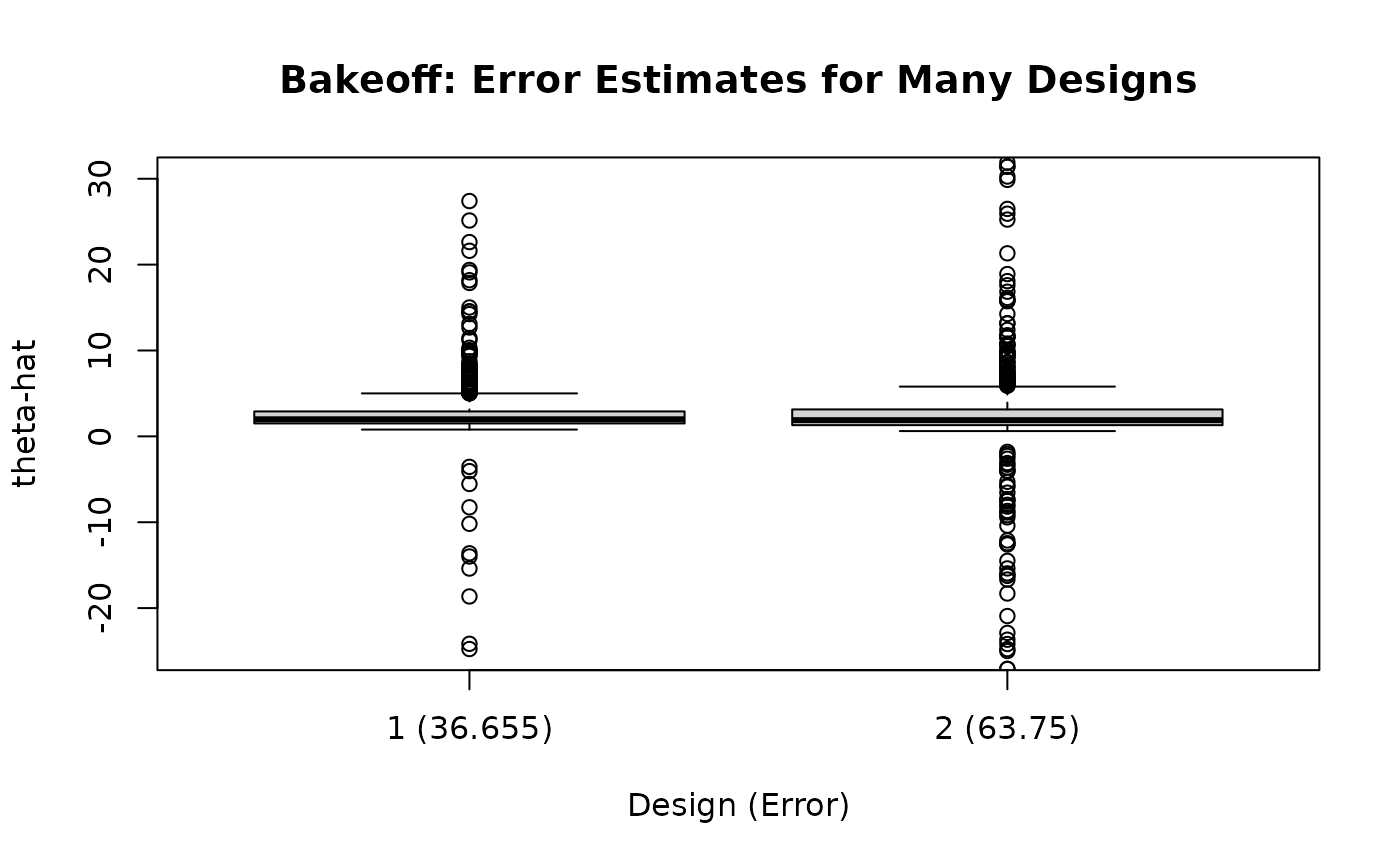
A visualiation for comparing slope-divided-by-intercept estimates for a number of designs
Source:R/public.R
design_bakeoff.RdA visualiation for comparing slope-divided-by-intercept estimates for a number of designs
Usage
design_bakeoff(
  xmin,
  xmax,
  designs,
  gen_resp = function(xs) {
1 + 2 * xs + rnorm(length(xs), 0, 1)
 },
  Nsim = 1000,
  l_quantile_display = 0.01,
  u_quantile_display = 0.99,
  error_est = function(est) {
quantile(est, 0.99) - quantile(est, 0.01)
 },
  num_digits_round = 3,
  draw_theta_at = NULL,
  xlab_names = NULL,
  ...
)
Arguments
- xmin
The minimum value of the independent variable.
- xmax
The maximum value of the independent variable.
- designs
A d x n matrix where each of the d rows is a design (the x values used to run the experiment).
- gen_resp
A model for the response which takes the design as its parameter.
- Nsim
The number of estimates per design. Default is
1000.- l_quantile_display
The lowest quantile of the simulation estimates displayed. Default is
0.025.- u_quantile_display
The highest quantile of the simulation estimates displayed. Default is
0.975.- error_est
The error metric for the estimates. The sample standard deviation (i.e.
sd) is unstable at low sample sizes. The default is the 90 percentile minus the 10 percentile.- num_digits_round
The number of digits to round the error results. Default is 2.
- draw_theta_at
If the user wishes to draw a horizontal line marking theta (to checked biasedness) it is specified here. The default is
NULLwith no line being drawn.- xlab_names
Text for the x-grid labels. This vector's size should equal
lenth(designs).- ...
Additional arguments passed to the
boxplotfunction.